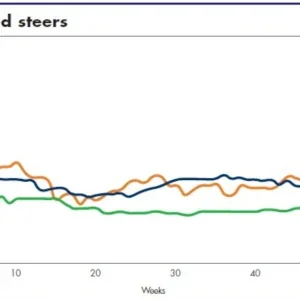
Benchmark heavy Texas steers had inched up in the early weeks of the month to $32 and $33, but within a week after APLF, those prices eased. Trading in Asia that calculates back to $29 and $30 FOB was being reported, and some on larger volumes.
That said, the volume of trading in regular weight Texas has been thin because much has gone directly into wet-blue production. Heavier-weight material was still plentiful during the period, with 74 minimum averages being sold at $35–36. While the cow sector was well sold ahead of the holiday, pressure on selections such as branded cows was mounting. Trading was again lower than the previous month with sales taking place between $10 and $12 on 52/54lb averages, with higher prices reserved for better quality material. During the Hong Kong fair, dairy cows saw an uptick in interest and were able to pull prices upward to the level of $24–25. While some residual interest after the fair kept prices steady, even those selections were facing some pressure towards the end of the month.
With government reporting having resumed its regular schedule after the shutdown, the usual complement of statistics was becoming available. The Cattle on Feed report indicated that numbers were up. Cattle and calves on feed for the slaughter market for feedlots with capacity of 1,000 or more head totalled 11.7 million head on 1 February 2019, which was slightly above 1 February 2018.
Placements in feedlots during January totalled 1.96 million head, 5% below 2018. Net placements were 1.90 million head. Marketings of fed cattle during January totalled 1.91 million head, 3% above 2018. Other disappearance totalled 61,000 head during January, 12% below 2018.
The US cattle herd expanded only modestly in 2018 after four years of aggressive growth. Signs are that this year will be the end of the expansion phase in the current cattle cycle, according to Cattle Buyers Weekly. The 2018 calf crop was up 1.8% on the year before, and 2019’s will be larger again, so we can expect to see larger supplies of feeder and fed cattle at least until 2021.
The delayed report: behind the USDA’s numbers
The USDA’s release of its delayed annual cattle inventory report confirmed the modest expansion. Most categories of cattle on 1 January reflected slightly larger year-on-year percentage increases than expected because the USDA revised most numbers downward for 1 January 2018. It revised its cattle and calves total down by 101,000 head, which meant this January’s total of 94.76 million head was up 0.5%, or 462,000 head, on a year ago.
The department’s biggest revision was in taking 257,000 head off its 2018 beef cow total, so the 2019 total of 31.766 million was up 1.0%. It took 23,000 head off its 2018 beef replacement heifer total, so the 2019 total of 5.925 million head was down 3.0%. The USDA also took 50,000 head off its number for the 2017 calf crop. Therefore, its 2018 total of 36.403 million head was up 1.8% on 2017.
In March, however, parts of the US Midwest, which is prime cattle production territory, were affected by severe flooding, resulting in major cropland and livestock losses. President Trump declared the state of Nebraska a “disaster area”, and the USDA has several programmes aimed at disaster relief for livestock and crops. Government weather entities also predict that spring rains and melting snow create the potential for major or moderate flooding in 25 states.
“This is shaping up to be a potentially unprecedented flood season, with more than 200 million people at risk for flooding in their communities,” the outlook document said. In fact, the agency indicated that above-average precipitation is likely in most of the US this spring, increasing the risk of floods.
As an added resource, the USDA’s Animal and Plant Health Inspection Service (APHIS) has launched a new ‘Pests and Diseases’ web page. The new page lists all pest and disease programmes managed by APHIS as part of its mission to protect US agriculture and natural resources. On the new page, users can search by type (plant, animal), keyword (avian, fruit fly, cotton), or by the specific pest or disease (coconut rhinoceros beetle, brucellosis). Users can also scroll through the page, which lists the pests and diseases alphabetically, and includes a corresponding image.
With regard to US export sales, the government resumed regular reporting at the end of February. Through week 12 of 2019, export sales of raw hides totalled 4.07 million and for wet-blue 1.509 million; together, sales were 5.58 million.
For the week ending 14 March, the combined total of raw and wet-blue hides sold but not yet shipped was 3.241 million. This is down 2% from the previous week’s 3.306 million. During the five weeks since the USDA resumed regular weekly reporting the combined outstanding figure was steadily declining.
East meets West
As China is the largest buyer of US hides, we note that the country imported fewer hides from the US in January 2019. China imported a total of 70.624 million kilograms of whole hides under 16kg, for a value of $82.591 million, an increase of 9% in volume and 7% in value over December 2018. Of this total, hides from the US in this category accounted for 31.145 million kilograms, or 44%. The value of these hides was $40.537 million, accounting for 49% of the total value. The average price per kilo of $1.30 was down $0.04 from December. The January total imported from the US was down 8.5% in volume and 11% in value from December.
A saying in recent years is that when China sneezes, the world catches a cold, signifying its economic influence and power. As the biggest buyer of US hides, our industry gets a taste of this every year during the Chinese New Year holiday, when most buyers are out of the market and activity slows markedly. This year, even the weeks following the holiday ended up being a testament to this phenomenon as most larger Chinese customers were sitting out the market and volumes were off.
One source noted that we cannot expect an improvement in hide prices without Chinese participation, and it was not active for much of February and March. That said, customers were smart to wait because every year, prices do indeed go down after the Hong Kong fair. Taking a look at the average price of the main steer selections at week 12 and then six weeks later, all were down in each of the past five years. This is not just for the past two years, which encompass the downward trend that started in March of 2017. That year, the post-fair drop was almost a universal 11%. In the previous three years, prices were down approximately 2–10%.
You might say that this is really bad news for sellers, but it may not be so significant. The average drop by the end of April for those years was 5%. That would mean a decline of $1.50–2.00 based on current steer price levels. The resulting prices would still be higher than the lows the market saw in the last quarter of 2018. At the end of March, most in the industry felt that a realignment of prices within origins and between origins was quite likely. With no major changes in demand expected in the short or medium term, and supplies continuing to be plentiful, prices cannot increase.
US Market in Review
Hidenet‘s flagship report, established in 1975, covers the recent cowhide prices for all major selections. US industry news and market predictions for hide prices are also regular features.
Hidenet


